Introduction
Most organizations are drowning in transaction data — and still can't answer basic questions about where their money goes. According to Ardent Partners research summarized by Zycus, only 35% of organizations have complete or significant spend visibility, and just 25% into their spending.
For procurement and finance leaders at mid-market and PE-backed companies, that gap has real consequences: budget overruns go undetected, maverick spend slips through unmanaged channels, and supplier negotiations start without the data to support them.
This article covers eight concrete best practices for building real-time spend visibility in 2026 — practical steps sized for mid-market teams, not enterprise IT budgets.
TL;DR
- Centralize spend data into one unified layer first — every other practice builds on that foundation
- A consistent categorization taxonomy turns raw transactions into comparable, actionable data
- Real-time dashboards replace lagging reports and let teams catch issues before they compound
- Build structured approval workflows to stop maverick spend before it happens
- Continuous audit cycles keep visibility accurate and directly tied to measurable savings
What Spend Visibility Really Means for Organizations in 2026
Spend visibility is the ability to track, categorize, and analyze every purchasing transaction — across all departments, suppliers, and cost centers — in real time. It's distinct from expense management (which tracks individual-level spending) and from spend management (the broader discipline of controlling and optimizing what gets spent) — it's the data foundation that makes both possible.
The stakes in 2026 are higher than they were even three years ago. According to KPMG's procurement research, leading procurement functions control 78% of total spend, while average organizations control just 30%.
PE portfolio oversight has tightened considerably, and AI-driven analytics have shifted spend visibility from a reporting function to a strategic capability that directly informs EBITDA outcomes.
Effective spend visibility spans three layers:
- Data capture: who bought what, from which supplier, at what price — the raw transactional record
- Spend analysis: turning that data into patterns, anomaly flags, and category-level trends
- Reporting & action: translating insights into decisions, with the right visibility for the right stakeholders
The eight practices below address where most organizations lose control across these layers — and how to close those gaps.
The 8 Best Practices for Spend Visibility in Organizations
Practice 1: Centralize Spend Data Into a Single Source of Truth
Fragmented data is the primary reason visibility fails. Transaction records scatter across ERPs, AP platforms, corporate card systems, and expense tools — and each system tells a different version of the story. McKinsey's procurement research found that 21% of CPOs report low data infrastructure maturity, meaning less than 70% of their spend data sits in one place.
What "centralized" means in practice:
- Integrating procurement systems, AP platforms, and card data into a shared repository or spend management platform
- Establishing data governance policies that define who owns each data feed, how often it refreshes, and what the standards are for data quality
- Resolving duplicate records, mismatched vendor names, and inconsistent currency formats at the source — not downstream
No dashboard, analytics layer, or AI capability delivers reliable results without this foundation.
Practice 2: Establish a Consistent Spend Categorization Taxonomy
Without a standardized classification framework, the same purchase gets coded five different ways by five different teams. That inconsistency destroys comparability and buries savings opportunities — you can't benchmark supplier pricing by category if the category field is meaningless.
Industry-standard frameworks like UNSPSC (United Nations Standard Products and Services Code) provide a globally recognized hierarchy for classifying products and services. Many organizations customize these frameworks to reflect their own category structures.
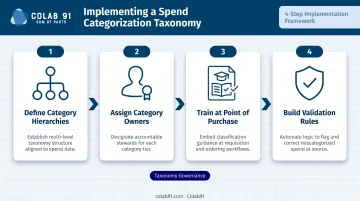
Practical steps to get categorization right:
- Define category hierarchies — align to UNSPSC or build a custom taxonomy that mirrors how your procurement function operates
- Assign category owners — someone must own each category's coding standards and keep them current as spending patterns evolve
- Train at the point of purchase — AP staff and department requestors need to code correctly when they create a purchase order, not retroactively
- Build validation rules — catch miscoded transactions automatically before they corrupt reporting
Deloitte's survey of 100 CPOs identified data quality and spend classification as among the most persistent barriers to procurement effectiveness — and this is one area where process discipline pays off faster than technology investment.
Practice 3: Move From Lagging Reports to Real-Time Dashboards
Monthly spend reports have a structural problem: by the time the data reaches finance leadership, the window to intervene has closed. Budget overruns are already locked in. Off-contract purchases have already been paid.
Real-time dashboards tied to live transaction feeds change that equation. Effective spend visibility dashboards should surface:
- Spend by category, department, and supplier
- Contract compliance rate and maverick spend percentage
- Budget variance — actual vs. committed vs. budgeted
- Anomalies flagged against historical baselines
- Drilldown to individual transaction level
The goal is not a prettier report. It's moving procurement and finance teams from historians to decision-makers. When a department's T&E spend spikes 40% in the first two weeks of a quarter, that's visible and addressable. On a monthly cycle, it's just a line item in a post-mortem.
Practice 4: Implement Structured Approval Workflows With Policy Guardrails
Structured, tiered approval workflows — triggered automatically based on spend threshold, category, or requestor level — ensure every dollar is authorized before it's committed. Without them, purchases bypass formal channels and disappear from visibility entirely.
Two things make this work:
- Automation over email — manual approval chains via email create invisible bottlenecks, lose audit trails, and introduce delays that push employees toward workarounds. Digital workflows with escalation rules enforce policy consistently.
- Policy embedded in process — approval requirements should reflect actual procurement policy (not just dollar thresholds), so the workflow itself trains employees on what requires review.
The downstream benefit is clean data. Every approved transaction carries the right metadata — department, cost center, category, approver — which feeds directly into spend visibility reporting without manual correction.
Practice 5: Actively Track and Reduce Maverick Spend
Maverick spend — purchases made outside approved suppliers or without following procurement process — is one of the most common and costly visibility gaps. APQC benchmarks show that bottom-performing organizations with over $500M in annual revenue have maverick purchasing equal to 2.5% or more of total purchases. For a $1B organization, that's $25M in unmanaged spend annually.
The process cost compounds it further: organizations with 2%+ maverick purchasing require 16 more hours at the median to issue a purchase order than those with under 1%.
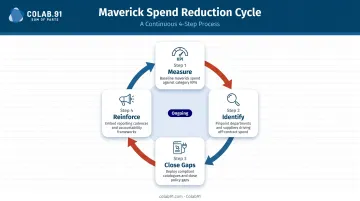
The cycle for reducing it:
- Measure — track maverick spend percentage as a standing KPI, not a one-time audit
- Identify — pinpoint which departments and categories drive the highest off-contract activity
- Close gaps — preferred supplier programs, catalog-based buying tools, and compliance reporting back to department heads all reduce the friction that drives maverick behavior
- Reinforce — regular reporting to department leaders creates accountability without requiring a policing mentality
Practice 6: Use Spend Analytics and AI to Surface Hidden Patterns
Spend visibility isn't just about knowing what happened — it's about understanding what it means and what to do next. AI-powered analytics go beyond standard reporting to surface:
- Anomalous pricing — the same item purchased at significantly different prices from the same supplier across divisions
- Supplier consolidation opportunities — fragmented spend across dozens of vendors in a category where three would suffice
- Duplicate purchases — redundant orders that manual review misses at volume
- Contract renewal windows — surfacing upcoming expirations early enough to negotiate from strength, not urgency
The challenge for mid-market organizations is capacity. Best-in-class procurement teams allocate 22% of staff to dedicated analytics functions, according to McKinsey — a ratio most mid-market companies can't replicate in-house.
Colab91 addresses this directly by building dedicated India-based procurement and spend analytics teams for mid-market and PE-backed organizations. The model pairs domain-expert analyst capacity with AI-powered spend analytics tools — giving clients the analytical depth of a best-in-class function without the hiring timeline or overhead. The leadership team's track record scaling analytics operations for firms including Carlyle Group, TPG, and Pediatric Associates anchors the capability in real procurement outcomes.
Practice 7: Proactively Manage Contracts and Supplier Relationships
Contracts scattered across email chains and shared drives represent a direct financial liability, not just an operational nuisance. WorldCC research found that poor contract management causes 8.6% average annual value erosion, with worst performers losing 15% or more. Only 39% of commercial practitioners believe their contracts effectively deliver desired outcomes.
Contract management connects to spend visibility in two direct ways:
- Missed renewals and off-contract buying — when teams don't know what contracts exist or when they expire, purchases default to catalog pricing instead of negotiated rates
- Negotiation leverage — spend data showing supplier concentration, payment terms, and pricing trends gives procurement teams the evidence to renegotiate effectively
Centralizing contracts into a searchable repository with automated renewal alerts converts a passive document archive into an active financial control. Supplier performance data, pricing benchmarks, and spend concentration analysis then inform every major supplier conversation.
Practice 8: Build a Continuous Spend Audit and Improvement Cycle
Spend visibility is not a one-time implementation. Data drifts — categories get miscoded, new spending patterns emerge outside existing taxonomies, and system integrations develop gaps. A recurring audit cadence keeps the foundation accurate.
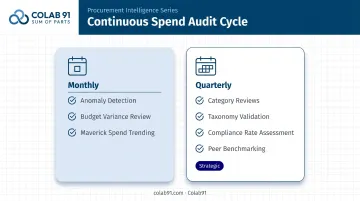
Monthly: Anomaly detection, budget variance review, maverick spend trending
Quarterly: Comprehensive category reviews, taxonomy validation, compliance rate assessment, benchmark comparison against industry peers
What a spend audit cycle should systematically cover:
- Reconcile actual spend against budgets and contracted rates
- Review maverick spend trends by department and category
- Validate category coding accuracy across the highest-volume transaction types
- Benchmark key metrics against industry standards to identify where performance lags
Without a recurring audit cycle, dashboards become stale and categories accumulate errors. The organizations that sustain spend visibility treat it as an operational discipline — not a project with a go-live date.
Common Barriers That Undermine Spend Visibility
Even organizations that invest in the right technology run into predictable obstacles. The three most persistent:
1. Fragmented data systems — Spend lives across ERPs, procurement platforms, AP tools, and card programs that were never designed to talk to each other. According to a Deloitte survey of 250+ CPOs, 57% cite siloed ways of working as the top barrier preventing procurement value delivery.
2. Inconsistent definitions and categorization — When different teams classify spend differently, cross-functional comparisons become meaningless. Finance reports one number, procurement reports another, and leadership doesn't trust either.
3. Lagging report cycles — Monthly reports convert finance teams into historians. By the time the data is reviewed, actioned, and corrected, another cycle has passed.
The human dimension matters as much as the technical one. Employees who don't understand why procurement process compliance matters — or who find the approved channel slower than buying directly — will consistently route around it. Cultural buy-in requires visible consequences for off-contract buying and visible benefits for compliance.
These barriers hit mid-market organizations especially hard. They've grown beyond spreadsheets but haven't yet built the procurement headcount or analytical capacity that large enterprises maintain. That gap shapes a critical decision: whether to build those capabilities internally or partner with teams that already have them.
Building Spend Visibility Capability: People, Process, and Technology
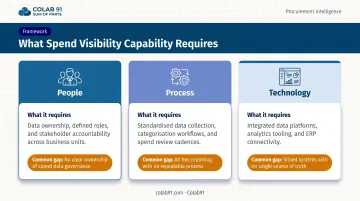
Technology alone doesn't create spend visibility. The three-layer model requires:
| Layer | What it requires | Common gap |
|---|---|---|
| People | Analysts who interpret data, manage categories, and drive supplier strategy | Mid-market teams are under-resourced |
| Process | Standardized workflows, approval governance, audit rhythms | Often informal or inconsistent |
| Technology | Integrated platforms that unify data and enable real-time reporting | Fragmented or underutilized |
Weakness in any one layer limits the value of the other two. A best-in-class platform with no analyst capacity produces dashboards that nobody acts on. An experienced analyst team working from fragmented, uncategorized data produces findings that can't be validated.
That gap is where most mid-market and PE-backed companies get stuck — the analyst bandwidth to act on data simply isn't there. Colab91 addresses this directly: dedicated India-based procurement and analytics teams that give organizations the domain expertise of an enterprise procurement function, structured around their specific spend categories and business context.
Madhur Kabra and Vijender Kapoor, Colab91's Managing Partners, built and scaled a 100+ practitioner analytics delivery center serving PE sponsors including Carlyle Group, TPG, and BC Partners. That operational depth is what they bring to every client engagement.
When all three layers are in place — the right people, consistent processes, and integrated technology — spend visibility stops being a reporting exercise and becomes a genuine driver of savings and supplier strategy.
Frequently Asked Questions
What is spend visibility and why does it matter for organizations?
Spend visibility is the ability to track and analyze all organizational purchasing — across departments, suppliers, and categories — in real time. It's foundational to cost control, compliance, and strategic financial decision-making; without it, budget overruns, maverick spend, and missed savings opportunities go undetected.
What is the difference between spend visibility and spend management?
Spend visibility is the data and reporting layer — knowing where money goes. Spend management is the broader discipline of controlling and optimizing that spending. Visibility is a prerequisite for effective spend management — without reliable data on where money flows, optimization efforts lack a foundation to build on.
What are the biggest barriers to achieving spend visibility in mid-market organizations?
The most common barriers are fragmented data systems that don't integrate, inconsistent spend categorization across teams, manual reporting cycles that lag too far behind actual activity, and insufficient analyst capacity to maintain and interpret the data reliably.
What metrics should organizations track to measure spend visibility success?
Key KPIs include:
- Percentage of spend under management
- Maverick spend percentage
- Contract compliance rate
- Category coverage ratio
- Savings realization rate
Together, these indicate how mature and reliable the visibility foundation is.
How long does it take to implement spend visibility best practices?
Foundational data centralization and categorization can be operational within 60–90 days. Building real-time dashboards and analytics capability typically takes 3–6 months. Beyond that, refining categorization logic, expanding category coverage, and improving data quality are ongoing — the work doesn't stop once dashboards are live.
Can mid-market companies achieve strong spend visibility without enterprise budgets?
Yes. By prioritizing a centralized data layer, standardizing categorization, and augmenting lean internal teams with domain expertise — through offshore analytics partners or specialist consultants — mid-market organizations can reach best-in-class spend visibility without enterprise-level investment.