Introduction
Most procurement organizations today have more data than they know what to do with. Spend dashboards are populated, classification engines are running, and reports land in inboxes every Monday morning. Yet when a contract auto-renews at last year's rates, when an RFx goes out without a current price benchmark, when a supplier review happens with no supporting spend data — it becomes clear that generating insights and acting on them are two very different problems.
That gap between analytics output and procurement decisions is fundamentally a workflow problem. This post examines what it actually takes to close it — where spend insights need to be embedded, what team structure and technical design make it sustainable, and where the talent constraints hit hardest for mid-market and PE-backed companies.
TL;DR
- Most procurement organisations generate spend insights but fail to act on them because analytics tools and workflow systems remain disconnected.
- Five workflows benefit most from embedded spend insights: sourcing events, contract renewals, supplier reviews, budget planning, and PO compliance.
- Effective integration requires alert architecture, role-based delivery, and translators who convert data into executable decisions.
- Mid-market and PE-backed companies face a dual constraint: limited capacity to both generate and act on insights at the same time.
- The real measure of success: what percentage of sourcing events and renewals were directly informed by spend data.
The Analytics-to-Action Gap: Why Insights Stall
Insight Latency Is the Real Problem
Insight latency — the delay between when spend data reveals an opportunity or risk and when a decision-maker receives and acts on it — is the primary reason analytics investments underdeliver. The bottleneck isn't data volume or tooling.
The structural cause is straightforward: analytics platforms (spend classification engines, BI dashboards) operate in a separate environment from workflow tools (ERP, P2P systems, contract repositories, approval queues). Insights don't automatically travel between them.
Someone has to carry them — typically an analyst who emails a report to a category manager who reads it three days later.
McKinsey data illustrates how serious the underlying readiness problem is: 21% of CPOs report low data infrastructure maturity (less than 70% of spend stored in one location), with another 30% at average maturity. When data infrastructure is fragmented, insight latency compounds.
The Timing Problem
Spend reports are typically produced on weekly or monthly cycles. Sourcing events, contract renewals, and supplier negotiations have specific windows. An insight delivered after a contract auto-renews adds no value — regardless of how accurate it was.
The distinction comes down to how signals reach decision-makers:
- Passive dashboards require a user to find the signal
- Action-ready insights surface the signal at the right moment, to the right person, in the right format to trigger a decision
Closing that gap is as much an organizational design problem as a technology one.
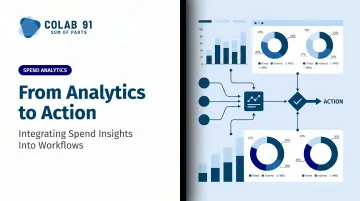
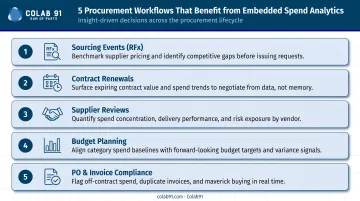
The Key Workflows Where Spend Insights Should Flow
Spend analytics doesn't improve procurement outcomes by existing — it does so by connecting to the moments when decisions get made. These five workflows are where those decisions concentrate.
Sourcing Events
Spend analytics should feed directly into RFx design, before the RFx is drafted. The signals worth surfacing:
- Volume fragmented across too many suppliers (consolidation opportunity)
- Prices paid drifting above market benchmarks (negotiation trigger)
- Category spend grown enough to justify a formal sourcing event
Without this upstream connection, sourcing teams design events based on last year's contracts and tribal knowledge rather than current spend reality.
Contract Renewals and Renegotiation
Procurement teams that wait for a renewal notification have already lost the window. Analytics should surface price creep or utilization gaps 90–120 days before renewal, with an alert routed directly to the category owner — not buried in a monthly report.
Contract compliance tracking — comparing actual invoiced prices to contracted rates — is the analytical foundation here. Price variance between contracted and invoiced amounts is one of the most actionable signals in procurement data, yet it rarely reaches the people who can act on it.
Supplier Performance Reviews
Supplier QBRs are often assembled manually by an analyst the day before the meeting. That's backwards. Spend analytics should automatically populate a structured pre-review brief covering:
- On-time delivery trends and compliance rates
- Volume versus contracted commitment
- Spend concentration risk (over-reliance on a single supplier)
APQC benchmarks show that the median organization considers only 20% of active suppliers strategic — meaning the other 80% often receive no analytical scrutiny at all.
Budget Planning and Forecasting
Category-level spend trends should flow directly into finance planning cycles, replacing spreadsheet-based guesswork with validated assumptions. The specific signals worth passing forward:
- Seasonal volume patterns — where spend reliably spikes or compresses by quarter
- Price index changes — commodity or services cost shifts that affect forward category budgets
- Supplier base shifts — consolidation or exit activity that changes supply risk and pricing leverage
When procurement analytics feed these inputs into budget planning, finance and procurement are working from the same baseline — not reconciling conflicting numbers two weeks before close.
PO and Invoice Compliance
APQC data shows that at the median, 10% of purchase orders are created after receipt of the associated supplier invoice — a clear sign that purchasing is happening outside approved channels. Real-time spend data should trigger workflow flags for:
- Purchases above threshold without a PO
- Invoices that don't match contracted prices
- Spend categories approaching budget limits
Each of these flags should route directly to an approval queue or escalation path inside the systems teams already use — not land in a report that gets reviewed two weeks later.
Building the Integration: From Output to Workflow Trigger
The Technical Foundation
Effective integration connects the analytics layer (spend cube, classification engine, BI output) to the operational layer (ERP, S2P platform, contract management system) via API or data connector. The specific architecture depends on the organization's existing stack — mapping current system connectivity before designing integration is a prerequisite.
Alert Architecture
This is where integration becomes operational rather than passive. Alert architecture means defining trigger conditions that convert a data threshold into a routed action. Examples:
- When supplier A's invoiced price exceeds contracted price by X%, route an alert to the category manager with context
- When spend in category B exceeds 80% of budget, notify the procurement lead and finance partner
- When a contract enters the 90-day pre-renewal window, surface utilization and compliance data to the category owner
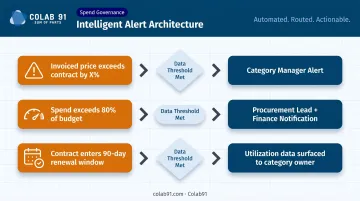
These triggers are what make the analytics layer operationally relevant — each one ties a data signal to a specific decision moment.
Role-Based Insight Delivery
Different stakeholders need different views at different moments:
| Role | What They Need | When They Need It |
|---|---|---|
| Category Manager | Supplier-level price variance alerts | Before negotiations and renewals |
| CPO | Category-level trend summaries | Ahead of portfolio reviews |
| Finance Leader | Budget deviation flags | During planning cycles |
Role-based delivery also reduces noise: each stakeholder receives signals relevant to their decisions, not the full firehose of spend data.
Data Quality as a Prerequisite
Analytics that feed workflows must be consistently classified, de-duplicated, and current. Stale or miscategorized data triggering incorrect alerts erodes trust faster than having no alerts at all. Establishing data governance standards before scaling integration isn't optional — it's the difference between a system people rely on and one they work around.
A phased approach reduces this risk meaningfully: start with one or two high-impact workflows (contract renewals and sourcing events have the clearest decision windows) before expanding. Deloitte's 2025 Global CPO Survey found that Digital Masters — procurement organizations with advanced technology investment — achieved 96% savings plan attainment versus 80% for followers, a gap that reflects both technology maturity and implementation discipline.
The Role of People and Organizational Design
The Mid-Market Talent Gap
The analytics-to-action gap looks different at a mid-market or PE-backed company than it does at a large enterprise. Large enterprises have dedicated procurement analytics teams. Mid-market companies often rely on one or two generalist procurement professionals who must simultaneously manage supplier relationships, run sourcing events, and interpret spend data.
Gartner's research makes the scale of this problem clear: only 14% of procurement leaders are confident their talent can meet the future needs of the function. And 96% of procurement leaders see at least a small gap in technology and data skills — with 68% saying those skills increased in importance over the prior 12 months.
This isn't just a technology problem. It's a capacity and capability problem.
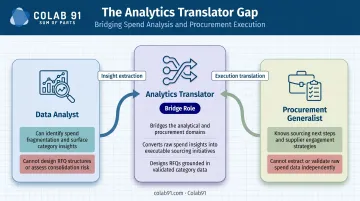
The Analytics Translator Function
The role that bridges data output and procurement execution is what might be called an analytics translator — someone who understands both the language of spend data and the mechanics of sourcing and category management.
Converting an insight ("our MRO spend is fragmented across 47 suppliers") into an actionable initiative ("consolidate to 3 preferred suppliers through an RFQ targeting categories X, Y, Z") requires domain knowledge that neither a pure data analyst nor a pure procurement generalist typically has in full. That gap shows up as:
- Data analysts who can identify fragmentation but can't design an RFQ or evaluate supplier consolidation risk
- Procurement generalists who know what to do next but can't extract or validate the insight from raw spend data
- In-house teams stretched too thin to develop depth in both areas at once
Colab91's capability center model addresses this directly for mid-market and PE-backed companies. Rather than functioning as external consultants, Colab91 embeds offshore procurement and analytics professionals who work within a client's existing workflows — acting as an integrated extension of the in-house team. The "Sum of Parts" approach augments in-house talent with domain expertise, so clients aren't choosing between generating insights and acting on them.
McKinsey estimates that best-in-class companies allocate 22% of procurement employees to analytics teams — a ratio that most mid-market organizations can only approach through a blended model. Colab91's track record includes PE-backed portfolios for Carlyle Group, TPG, Elliott, and BC Partners, where fast, measurable procurement value creation was a primary requirement.
Measuring Whether Your Integration Is Working
The Right Metric
Dashboard adoption is the wrong measure. The right one: **what percentage of material sourcing events, contract renewals, and supplier reviews were directly informed by spend analytics data** — rather than being triggered manually or by calendar?
This measures workflow penetration. It captures whether insights are actually reaching decisions, not whether people logged into a dashboard.
Tracking Feedback After Action
After an analytics-triggered action is taken — a renegotiation initiated by a price variance alert, a sourcing event launched after spend concentration was identified — track whether the outcome matched the insight's projection. Did savings materialize? Did supplier behavior change? Did compliance improve?
Closing this loop delivers two outcomes:
- Improves future analytics quality by validating which signals actually predict results
- Builds organizational trust in acting on data, rather than waiting for consensus
The Maturity Progression
Where an organization sits on this curve determines how much of that trust translates into consistent action. Most move through three distinct stages:
- Level 1 — Ad-hoc review: Analysts produce periodic reports; procurement teams review when time allows
- Level 2 — Configured workflow triggers: Alerts route to specific stakeholders based on defined thresholds; insights enter decision workflows
- Level 3 — Predictive and prescriptive action: AI-generated recommendations embedded in procurement tools; insights surface before decisions are made, not after
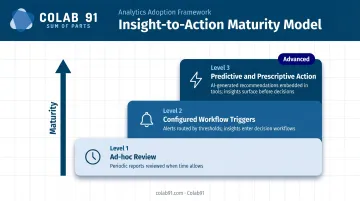
Gartner's analytics framework defines this progression from descriptive ("what happened") to predictive ("what is likely to happen") to prescriptive ("what should be done"). Most procurement organizations today operate primarily at Level 1. Moving to Level 2 is achievable with the right architecture and people. Level 3 remains the target — and for mid-market organizations, the path there typically starts with getting Level 2 workflows consistently right.
Frequently Asked Questions
How do you integrate AI into business intelligence?
AI integration into BI means connecting machine learning models to existing data pipelines so they automatically classify data, detect anomalies, and surface prioritized recommendations. In spend intelligence, this routes insights continuously to relevant workflows without requiring manual analyst intervention.
What are the 5 stages of business intelligence?
The TDWI Analytics Maturity Model identifies five stages: Nascent, Early, Established, Mature, and Advanced/Visionary. In procurement, each stage represents a step closer to insights that flow directly into sourcing and contracting workflows rather than sitting in static reports.
What are the 4 pillars of business intelligence?
The four core pillars are data integration, data quality and governance, analytics and reporting, and performance management. All four must be functional before insights can reliably feed procurement workflows; weak data governance alone is enough to break the integration.
What are the three major types of business intelligence?
Descriptive BI covers what happened, predictive BI anticipates what is likely to happen, and prescriptive BI specifies what action to take. Most procurement organizations still operate at the descriptive level. The shift to prescriptive BI is what enables spend insights to trigger workflow actions instead of informing retrospective reviews.
Why don't spend analytics insights lead to action in most organizations?
The most common barriers are tool disconnection (analytics and workflow systems live separately), insight latency (reports arrive after decision windows have closed), and talent gaps where no one owns the translation from data to executable initiative. Mid-market companies without dedicated analytics teams typically face all three at once.
What is the difference between spend visibility and workflow-integrated spend intelligence?
Spend visibility means you can see what's happening with your spend. Workflow-integrated spend intelligence means that data automatically surfaces to the right stakeholder at the right moment with a configured trigger for action — shifting procurement from reactive reporting to proactive decision execution.