Introduction
US healthcare spending hit $5.3 trillion in 2024 — $15,474 per person — and now accounts for 18% of GDP, according to CMS. For healthcare organizations operating on thin margins, that pressure lands directly on procurement and finance teams.
Hospital operating margins remain well below pre-pandemic levels, while drug costs rose 15.2% and supply expenses jumped 13.2% year-over-year in 2024. At that scale, uncontrolled internal spend becomes a board-level risk, not just a procurement headache.
Healthcare spend analysis is the structured discipline organizations use to answer one question: where is the money actually going? The answer drives category strategy, contract compliance, and supplier negotiations — and organizations without a clear answer routinely leave millions unrecovered.
This guide covers how to execute spend analysis in practice, and what separates organizations that treat it as a one-time exercise from those that compound savings year over year.
TL;DR
- Healthcare spend analysis systematically collects, cleanses, categorizes, and analyzes purchasing data to surface savings opportunities
- Core spend categories include clinical supplies, pharmaceuticals, facilities, IT, and administrative services
- The process follows five stages: define scope → gather data → cleanse and normalize → categorize → analyze and act
- Savings emerge through supplier consolidation, contract compliance, and strategic sourcing — identified through regular analysis
- Colab91 builds offshore India teams for mid-market and PE-backed healthcare organizations, turning spend analysis into a continuous, actionable capability
What Is Healthcare Spend Analysis?
Healthcare spend analysis is the systematic process of collecting, cleansing, classifying, and analyzing an organization's purchasing and expenditure data — across all categories — to understand spending patterns, identify inefficiencies, and prioritize cost management actions.
The scope is broader than most teams initially assume. It covers:
- Direct clinical spend: medical/surgical supplies, pharmaceuticals, devices, lab services
- Indirect spend: IT and technology, facilities and maintenance, professional services, administrative functions
- Workforce and staffing spend: contract labor, agency fees, temporary staffing
This applies across provider organizations — hospitals, physician groups, post-acute facilities — as well as PE-backed healthcare platforms managing multiple acquired entities simultaneously.
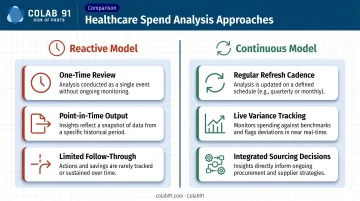
Reactive vs. Continuous Approaches
Most organizations start reactively: a one-time spend review triggered by a deal, a budget shortfall, or a board request. The output is a point-in-time snapshot — useful for immediate decisions, but it goes stale within a quarter.
Leading organizations shift to continuous spend monitoring instead. Periodic (monthly or quarterly) refresh cycles track contract compliance, flag emerging category trends, and feed into ongoing sourcing decisions:
- Reactive model: one-time review, point-in-time output, limited follow-through
- Continuous model: regular refresh cadence, live variance tracking, integrated sourcing decisions
Tools range from Excel-based models to spend analytics platforms like Jaggaer or Coupa — the right choice depends on data volume and team maturity. What matters more than tooling is execution discipline: a well-run manual review consistently outperforms an analytics platform that nobody maintains.
Why Healthcare Spend Analysis Is Critical
Without spend visibility, procurement teams can't prioritize. They spend time reacting to supplier issues and invoice exceptions rather than proactively managing category strategy and contract performance.
The scale of what's at stake makes this concrete. Hospital and physician services alone accounted for $2.74 trillion of US national health expenditure in 2024 — more than half the total. Even modest improvements in contract compliance and pricing consistency translate into material dollar savings at the organizational level.
What Spend Analysis Actually Enables
- Exposes maverick spend: purchases made outside negotiated agreements, often by site managers who don't know (or don't follow) contracted pricing
- Uncovers supplier consolidation opportunities where tail spend fragmentation is driving up transaction costs and eliminating volume leverage
- Sharpens negotiation leverage by giving procurement teams actual spend data and pricing variance analysis before any supplier conversation
- Focuses sourcing investment on the right categories (not every spend area warrants a full RFP)
- Builds the clean data baseline required for ongoing contract compliance monitoring
The PE-Backed Context
For private equity-backed healthcare platforms, the urgency is amplified. Global healthcare PE deal value reached an estimated $115 billion in 2024, with North America representing 65% of that total. Sponsors typically demand cost transparency and EBITDA improvement within the first 12–18 months post-acquisition. Structured spend analysis is almost always the starting point for that work, establishing the baseline before any sourcing initiative can be credibly scoped or measured.
How Healthcare Spend Analysis Works: Step by Step
This is where organizations most commonly stumble — not in understanding the concept, but in execution. Poor data quality, inconsistent categorization, and analysis that never translates into contracted savings are the most frequent failure modes.
Step 1: Define Scope and Objectives
Start by answering two questions before touching any data:
- What's in scope? Single facility or multi-site platform? One fiscal year or two? All spend categories or indirect only?
- What's the business objective? One-time diagnostic for a deal, or an ongoing managed process?
The answer to the second question determines the rigor, tooling, and resourcing required. A post-acquisition diagnostic and a sustained procurement monitoring program look very different in practice.
Step 2: Gather and Consolidate Spend Data
Pull from every source that touches purchasing:
- ERP and AP systems
- GPO purchase history
- Contract management platforms
- P-card transaction data
- Manual invoices and PO-less payments
In multi-entity healthcare organizations, spend data routinely lives across three or more ERP instances — a byproduct of roll-up acquisitions where integration hasn't been completed. Assuming one system captures everything is a mistake most teams only make once.
Step 3: Cleanse and Normalize the Data
Data quality determines insight quality. Before any analysis, you need to:
- Resolve supplier duplicates, subsidiaries, and aliases (the same distributor often appears under a dozen name variations)
- Normalize time periods and currency for comparability across entities and fiscal years
- Flag duplicate payments, outlier invoices, and PO-less transactions that need review
Organizations that skip this step produce category summaries that mislead rather than inform. A spend report showing $2M in medical supplies from "Medline" is unreliable if the same vendor also appears as "Medline Industries," "Medline Inc.," and "Medline Industries LP."
Step 4: Categorize and Classify Spend
Apply a healthcare-appropriate spend taxonomy. Standard categories include:
- Medical/surgical supplies
- Pharmaceuticals
- Lab and diagnostics
- Facilities and maintenance
- IT and technology
- Staffing and workforce
- Administrative services
One complication specific to healthcare: a single distributor may supply products across multiple categories. That requires line-item-level classification, not just supplier-level mapping. Tagging at the invoice line level takes more time upfront but produces far more actionable category views.
Step 5: Analyze Patterns and Identify Opportunities
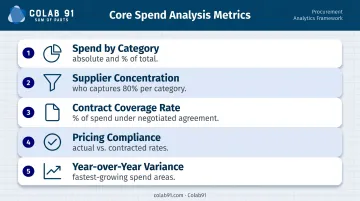
Run the core analyses:
- Spend by category (absolute and as % of total)
- Supplier concentration — who captures 80% of spend in each category?
- Contract coverage rate — what percentage of spend is under a negotiated agreement?
- Pricing compliance — are actual purchase prices consistent with contracted rates?
- Year-over-year variance — where is spend growing fastest?
Prioritize using an impact-effort lens. High-spend categories with low contract coverage are the right place to start — especially where pricing benchmarks reveal gaps against GPO rates or market comparables.
A Practical Example: PE-Backed Physician Group
Consider a PE-backed multi-site physician group (30 locations, 12 months post-acquisition). The sponsor has asked the procurement team to find $3–5M in cost savings for the next budget cycle.
The team scopes the work as all non-labor indirect and clinical supply spend across all sites for the past 24 months. Spend data sits across three separate ERP instances, a common outcome in roll-up platforms where system integration hasn't been prioritized post-acquisition. Pulling and reconciling that data takes several weeks.
What the analysis surfaces:
- 400+ unique vendors in the normalized supplier list
- 80% of spend concentrated in roughly 40 suppliers
- Significant maverick spend — individual site managers purchasing outside GPO pricing, often because contracted alternatives weren't communicated or enforced at site level
- Facilities maintenance spend fragmented across 60+ local vendors with no regional coordination
How insights convert to action: The team prioritizes three sourcing initiatives:
- Med-surg supply consolidation to the preferred GPO contract across all sites
- Facilities vendor consolidation by region, reducing from 60+ vendors to 8–10 regional partners
- Lab services contract renegotiation based on volume benchmarking across all sites
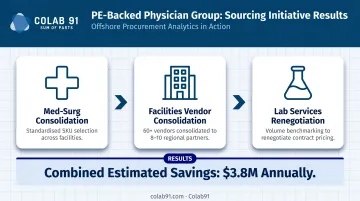
Combined estimated savings: $3.8M annually, within the sponsor's target range. A clear contracting roadmap makes those savings real and auditable.
Speed and rigor matter as much as the findings. Data that translates quickly into negotiated contracts and monitored compliance drives actual cost reduction. Spend analysis that sits in a deck doesn't.
How Colab91 Can Help
Building the internal capability to run spend analysis continuously — and act on it consistently — is harder than running a one-time diagnostic. It requires data management resources, category expertise, and ongoing reporting capacity that most mid-market healthcare organizations don't have sitting idle.
Colab91 builds dedicated offshore India teams that specialize in procurement analytics and sourcing support. Unlike staff augmentation or transactional BPO, these are structured capability centers that function as direct extensions of the client's procurement and finance functions.
For healthcare spend analytics specifically, Colab91's teams cover:
- Spend data cleansing, normalization, and taxonomy mapping at the volume and frequency that ongoing monitoring requires
- Category-level spend reporting with savings opportunity identification and prioritization
- Contract compliance monitoring — tracking actual purchase prices against negotiated rates and surfacing exceptions for action
- Supplier performance tracking and ongoing analytics infrastructure built on unified, durable data layers

The Colab91 leadership team brings direct healthcare experience to this work:
- Erika Jung (Advisor) served as CPO for Pediatric Associates, a TPG portfolio company, leading enterprise-wide cost transformation
- Managing Partners Madhur Kabra and Vijender Kapoor built and scaled Impendi's offshore operations (later acquired by Accenture) to 100+ practitioners, supporting PE sponsors including Carlyle Group and TPG
- Kindred Healthcare is among the healthcare organizations the team has supported directly
For mid-market and PE-backed healthcare organizations that need spend analytics capability quickly, Colab91's model delivers the domain expertise and operational infrastructure without the time or cost of building a large onshore team.
Conclusion
Healthcare spend analysis is an operational discipline — the ongoing practice of turning purchasing data into decisions that protect margins and compound savings over time. It doesn't have a completion date.
The organizations that treat it as an annual fire drill get one-time results. Those that build it into a continuous, structured capability — with clean data, consistent categorization, and systematic follow-through on sourcing initiatives — are the ones that show up to supplier negotiations with leverage and walk away with contracted savings that hold.
Organizations that build structured procurement visibility now carry a measurable cost advantage into every budget cycle that follows — one that compounds as supplier relationships mature and data quality improves.
Frequently Asked Questions
What are the main categories in a healthcare spend analysis?
Core categories include clinical supplies (medical/surgical, pharmaceuticals, devices), lab and diagnostics, facilities and maintenance, IT and technology, administrative services, and staffing. Category taxonomy should be tailored to the organization's size and structure — a multi-site physician group will look different from a health system.
What is the difference between direct and indirect healthcare spend?
Direct spend covers goods and services tied directly to patient care — medical supplies, drugs, diagnostic services. Indirect spend covers operational inputs like IT, facilities, and professional services. Both require analysis, but sourcing strategies, supplier dynamics, and GPO applicability differ between the two in material ways.
How do you collect and clean data for healthcare spend analysis?
Teams pull data from AP/ERP systems, GPO purchase histories, and p-card records. Cleansing means resolving supplier name duplication, standardizing category coding, and flagging PO-less invoices before classification begins. Get this wrong and every downstream insight is unreliable.
How often should healthcare organizations conduct a spend analysis?
A full diagnostic review is typically done annually or post-acquisition. Leading organizations run ongoing monthly or quarterly spend monitoring to track contract compliance, catch maverick spend early, and surface emerging category trends before they become budget problems. The cadence depends on spend volatility and organizational maturity.
What tools are used for healthcare spend analysis?
Options range from Excel-based models to dedicated platforms like Jaggaer, Coupa, and Conga for contract management. The right tool depends on data volume, system complexity, and the team's analytical maturity — a well-managed Excel process often outperforms an underutilized enterprise platform.
How does healthcare spend analysis support PE value creation plans?
PE sponsors typically use spend analysis in the first 100 days post-acquisition to establish a cost baseline and surface quick-win sourcing opportunities. Building that procurement foundation early is what sustains savings through the hold period — and gives EBITDA improvement plans an evidence base to stand on.