Introduction
Most companies have no idea what they're actually spending on software. They know the big contracts — the ERP, the CRM, the cloud infrastructure — but the full picture? That's scattered across expense reports, departmental credit cards, and auto-renewing subscriptions that nobody authorized and nobody reviews.
According to Zylo's 2025 SaaS Management Index, organizations waste an average of $21 million annually on unused SaaS licenses. For a company with 500 employees, average SaaS spend now runs $4,830 per person per year — up nearly 22% year-over-year. Without a consolidated view of that spend, the waste compounds silently across every renewal cycle.
SaaS spend analytics closes that gap by consolidating fragmented data into a single, actionable picture of your software portfolio. This guide covers what it is, why it matters specifically for mid-market and PE-backed organizations, and how to execute it — with a practical walkthrough of the process.
TL;DR
- SaaS spend analytics consolidates, categorizes, and interrogates software subscription data to surface waste and drive smarter decisions.
- Without it, companies auto-renew unused licenses, fund duplicate tools, and negotiate renewals without reliable data.
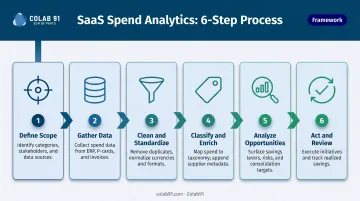
- The process: define scope → gather data → clean and classify → analyze → act and review.
- Benefits include cost reduction, compliance improvement, stronger vendor leverage, and more accurate budgeting.
- Mid-market and PE-backed companies gain the most, and many are building dedicated analytics capabilities rather than adding yet another platform.
What Is SaaS Spend Analytics?
SaaS spend analytics is the structured process of consolidating, categorizing, and interrogating data about software subscription costs and usage to surface insights that drive smarter tech stack decisions.
SaaS spend analytics and SaaS spend management are closely related but distinct. Analytics is the intelligence layer — understanding what you have, what it costs, who uses it, and where the waste is. Management is the operational layer — acting on renewals, renegotiating contracts, and enforcing procurement policy. Both are necessary, but analytics comes first: without visibility into the data, operational decisions are guesswork.
SaaS spend analytics is designed to answer three questions:
- How much are we really spending on software? (Across all departments, all payment methods, all vendors)
- Are we getting the value we're paying for? (Usage rates, adoption, license utilization)
- Where are the opportunities? (Consolidation, renegotiation, cancellation)
These questions sound straightforward. In practice, answering them requires pulling data from multiple disconnected systems, cleaning it, and applying consistent taxonomy — and that groundwork is what separates actionable insight from guesswork. The sections below break down exactly how that process works.
Why SaaS Spend Analytics Is Critical for Modern Companies
SaaS purchasing has become thoroughly decentralized. According to Zylo's 2025 SaaS Management Index, lines of business now account for 70% of SaaS spend, while IT controls just 26%. That means most software decisions are made by department heads, team leads, and individual employees — often without formal procurement involvement.
The downstream consequences are predictable:
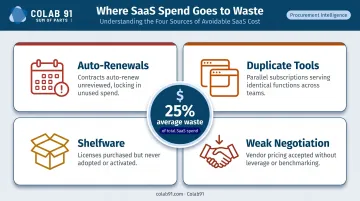
- Auto-renewals slip through — contracts with 30–90 day cancellation windows lapse without review
- Duplicate tools across departments solving identical problems (Productiv found companies average 8.9 project management tools and 9.5 meeting and scheduling apps)
- Shelfware accumulates — licenses purchased for projects that ended, headcount that left, or workflows that changed
- Weakened negotiating position at renewal, when vendors know you haven't done your homework
These aren't just operational nuisances for mid-market and PE-backed companies — they're financial ones. SaaS spend directly affects EBITDA, cost-per-headcount metrics, and the operational discipline PE sponsors expect during value creation reviews and due diligence. A $3M software portfolio with 25% waste is a $750,000 problem. Spend analytics makes it visible and fixable.
Key Benefits at a Glance
- Full portfolio visibility across all departments and payment methods
- Data-backed license rightsizing based on actual usage, not assumed utilization
- Stronger negotiation leverage with vendors at renewal
- Reduces compliance exposure from shadow IT and unauthorized software
- More accurate technology budgeting for planning cycles
How SaaS Spend Analytics Works — Step by Step
The process isn't complicated, but it requires discipline at each stage. Most teams stumble in predictable places: working from incomplete data, skipping validation, or producing a report without translating it into decisions. Here's where each step goes wrong — and how to avoid it.
Step 1 — Define Scope and Goals
Before pulling a single data point, clarify what the analysis needs to accomplish. Is this about preparing for a renewal cycle? Identifying consolidation opportunities? Building a baseline for budgeting?
Define the time period (typically 12–24 months), the business units in scope, and the specific decisions this analysis will inform. Without this, teams end up with a sprawling dataset that answers no particular question.
Step 2 — Gather Data from All Sources
Pull data from every relevant system — ERP, accounts payable, corporate card records, SSO/identity providers, procurement platforms, and SaaS admin consoles. Missing even one source creates blind spots.
The most common mistake here is trusting a single export. Finance sees AP-approved purchases. IT sees what's in the SSO directory. Neither sees everything. Coverage across all sources is what separates complete visibility from a partial picture.
Step 3 — Clean and Standardize
Raw data from multiple systems is messy. Vendor names vary ("Salesforce," "salesforce.com," "SFDC"), coding is inconsistent, and duplicates are common. Normalize everything: establish a single master vendor list, reconcile against the general ledger, and remove duplicate records.
Teams that skip this step pay for it in Step 5, when analysis produces contradictory numbers that nobody trusts.
Step 4 — Classify and Enrich
Map spend to a logical taxonomy — by function, department, vendor tier, or business unit — and enrich records with metadata: contract status, renewal dates, seat counts, and usage data where available.
Usage data is where the clearest waste signals live. If a tool shows 20% seat utilization, that's not an assumption — it's a finding.
Step 5 — Analyze and Surface Opportunities
Run analytical views across four dimensions: by vendor, by category, by department, and by usage rate. Look specifically for:
- Unused or underutilized licenses
- Overlapping tools solving the same problem
- Off-contract or shadow IT spend
- Price variance versus market benchmarks
- Upcoming auto-renewals with no assigned owner
Step 6 — Act and Review
This is where most teams stop short. Analysis produces a report; the report gets shared; nothing happens. Step 6 converts findings into a prioritized action plan with named owners, timelines, and expected savings — distinguishing quick wins (cancel unused licenses) from longer-cycle work (renegotiate multi-year contracts).
Build a recurring review cadence into the process from the start. A one-time audit captures a snapshot; regular cycles are what turn savings identification into compounding, realized value.
SaaS Spend Analytics in Action: A Practical Walkthrough
Take a 500-person mid-market company with a $3M+ annual SaaS portfolio spread across 80+ tools, managed loosely across IT, finance, and individual departments. No centralized owner. No renewal calendar. Contracts auto-renewing by default.
Steps 1–2: Scope and Data Gathering
The team defines their goal: prepare for an upcoming renewal cycle and identify consolidation opportunities. They set a 12-month lookback window and begin pulling data from four systems — their ERP, AP records, corporate card data, and the IT-managed SSO directory.
The first surprise: the consolidated view reveals 30% more active vendors than anyone expected. Several tools appear in both the corporate card data and the AP system under different vendor names. Others exist only in the SSO logs — purchased by department heads and never registered with finance.
Steps 3–4: Cleaning and Classification
After normalization, the team builds a master vendor list and maps everything to a functional taxonomy. What emerges is a clear picture of redundancy:
- Three separate project management platforms, each used by different departments
- Two active video conferencing licenses (one legacy, one adopted during a reorg)
- A design platform with fewer than 20% of seats showing active usage in the past 90 days
All three are on auto-renew. None has a designated owner.
Step 5–6: Analysis, Action, and Realized Savings
With clean, classified data, the analysis surfaces three distinct action categories:
| Category | Examples | Estimated Savings |
|---|---|---|
| Immediate cancellations | Unused design seats, redundant licenses | ~$85K annually |
| License downgrades | Rightsize to actual active users | ~$120K annually |
| Renewal renegotiations | Three contracts renewing in 60–90 days | ~$200K+ |
That quantified savings estimate makes the business case concrete — something the team can defend in any budget review.
The team then assigns an owner to each action, sets deadlines, and begins tracking realized savings against the estimate. Within 90 days, cancellations and downgrades produce measurable results. The renewal negotiations — backed by usage data and benchmark pricing — yield better contract terms than any previous cycle.
The more durable outcome is the review cadence itself. Established as part of this final step, it catches the next wave of waste before it auto-renews.
How Colab91 Can Help Build Your SaaS Analytics Capability
Most mid-market companies don't lack information about their SaaS waste — they lack the dedicated capacity to do something about it consistently. Buying another platform doesn't solve that problem. Having practitioners who execute the full analytics lifecycle does.
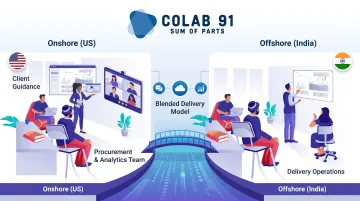
Colab91 builds offshore capability centers staffed with domain-experienced procurement and analytics practitioners. Rather than a one-off audit, the model establishes a durable function covering data consolidation, classification, analysis, and action tracking on an ongoing basis.
The team operates as an extension of the client's finance or procurement function — not as a separate vendor engagement.
What makes the model well-suited for SaaS analytics work:
- Spend analytics practitioners at the top — Madhur Kabra and Vijender Kapoor (Managing Partners) scaled a 100+ person offshore analytics organization at Impendi (acquired by Accenture), serving Carlyle Group, TPG, Elliott, and BC Partners
- PE environment fluency — the team delivers to the operational rigor and reporting cadence PE sponsors expect, with direct experience at portfolio companies including Pediatric Associates (TPG-backed)
- Blended onshore/offshore delivery — Jeff Skiles (Director of USA Operations) provides US-based client guidance while India-based teams handle delivery, keeping costs well below a fully onshore model
These credentials translate directly to the SaaS analytics context: structured data work, repeatable processes, and stakeholder-ready output. For mid-market companies that need this capability fast, Colab91's model is built to reach operating scale quickly and flex as the scope changes — without the hiring risk or internal build time.
Frequently Asked Questions
What is the difference between SaaS spend analytics and SaaS spend management?
Analytics is the intelligence layer — understanding what's being spent, who's using it, and where the waste is. Management is the operational layer — acting on renewals, enforcing contracts, and making procurement decisions. Analytics comes first; without a clear spend picture, management decisions are reactive rather than deliberate.
How often should companies conduct SaaS spend analysis?
SaaS-heavy organizations benefit from a monthly pulse on key metrics and a deeper quarterly review of categories and upcoming renewals. Annual audits capture a moment in time. Continuous monitoring is what protects against auto-renewals that quietly process before anyone reviews them — most carry 30–60 day cancellation windows.
What are the most common sources of SaaS spend waste?
The four most common: unused or underutilized licenses, duplicate tools solving the same problem across departments, auto-renewals processed without review, and shadow IT purchases made outside formal procurement channels.
What data sources are needed to run SaaS spend analytics effectively?
At minimum: your ERP or accounting system, accounts payable records, corporate card data, SSO/identity provider logs, SaaS admin consoles, and the contract repository. Gaps in any one source typically mean hidden spend goes uncounted.
How do PE-backed and mid-market companies typically approach SaaS spend analytics?
PE-backed companies face particular pressure to demonstrate cost discipline and margin improvement. Many are moving away from one-time audits toward ongoing offshore capability centers that execute the analytics function continuously — delivering recurring savings without adding headcount to the internal team.
What ROI can companies realistically expect from SaaS spend analytics?
A Forrester TEI study commissioned by Productiv reported 234% ROI over three years for a composite organization with 2,000 employees and 240 SaaS applications. Hard savings come from eliminated and renegotiated spend; soft savings come from hours reclaimed from manual reconciliation — with soft savings alone often reaching hundreds of hours annually in mid-market organizations.