Introduction
External spend typically accounts for 30%–70% of total expenditure in most organizations — yet most of it never gets analyzed beyond basic reporting. According to Deloitte's 2023 Global CPO Survey, only 30% of procurement leaders hit their specific cost-savings performance-to-plan targets, and the gap between identified savings and captured savings continues to widen.
The core problem isn't a lack of data. Most procurement teams sit on substantial transaction history across their ERP and procurement systems. The problem is the analytical framework applied to that data — or rather, the absence of one.
Spend reporting tells you what happened. Advanced procurement analytics tells you what to do about it. The gap between descriptive visibility and actionable intelligence is where most mid-market and PE-backed procurement teams leave significant value on the table.
Closing that gap is what this guide is about. It covers where savings actually hide in procurement data, the analytical techniques used to surface them, how to build a data foundation that makes analysis reliable, and how to measure what you find.
TL;DR
- Procurement analytics spans four stages (descriptive, diagnostic, predictive, prescriptive), each unlocking larger savings than the last.
- Key opportunities — tail spend, contract leakage, supplier fragmentation, price variance — stay hidden without structured analysis.
- Clean, classified, and enriched spend data is the prerequisite — not an afterthought.
- Measure savings by separating hard savings from cost avoidance, each tied to an auditable baseline.
The Analytics Maturity Gap: Why Most Procurement Teams Leave Savings on the Table
Most procurement organizations operate somewhere on a four-stage maturity curve:
| Stage | Question Answered | Savings It Enables |
|---|---|---|
| Descriptive | What happened? | Historical pattern visibility |
| Diagnostic | Why did it happen? | Root cause identification |
| Predictive | What will happen? | Proactive sourcing decisions |
| Prescriptive | What should we do? | Highest-value savings recommendations |
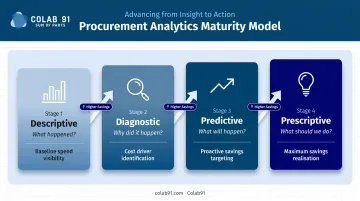
The gap between descriptive and prescriptive is substantial — and the data reflects it. Hackett's 2025 Procurement Agenda Study ranks data analytics and reporting as the #1 procurement transformation initiative, yet even with 74% adoption of spend analytics (including pilots), most organizations remain anchored at the descriptive stage — generating reports rather than recommendations.
The performance consequence is direct. Deloitte's 2025 survey found that procurement leaders met or exceeded cost-savings plans at 96%, compared to 80% for followers. The differentiator wasn't budget or headcount — it was analytical depth.
What Advancing Maturity Actually Requires
Moving up the curve is not simply a technology purchase. It requires three things working in parallel:
- Clean, classified spend data that reflects actual purchasing behavior across all business units and systems — not just what the ERP reports
- Procurement-literate analysts who can translate patterns into sourcing action, not just surface trends in a dashboard
- A structured execution process that converts insights into owned, tracked, and verified savings initiatives
PE portfolio companies feel this gap most acutely. KPMG notes that PE funds face mounting pressure to deliver measurable EBITDA improvements amid staffing constraints and price inflation. Lean procurement teams rarely have the analytical bandwidth to operate above the descriptive stage consistently — which is precisely where savings get left on the table.
Where Cost Savings Actually Hide in Procurement Data
Tail Spend and Maverick Purchasing
Tail spend — the long tail of low-value, high-frequency purchases — typically comprises 80%–90% of purchased items while representing only the bottom 10%–20% of total spend. The dollar amounts look small per transaction, but they accumulate fast.
McKinsey research illustrates the scale directly: for a company with $3B in direct spend, unmanaged tail spend of $400M can represent $40M in missed savings at a conservative 10% savings rate. Across its examples, McKinsey found:
- Tail spend savings potential of 5%–15%
- Supplier bases consolidated from several hundred vendors down to approximately 50
- Largest gains concentrated in categories with the highest vendor fragmentation
ABC classification structures this analysis: A-tier suppliers (roughly the top 20% by spend) receive strategic sourcing attention; C-tier suppliers (the long tail) are where maverick buying concentrates and where consolidation opportunities are largest.
Supplier Fragmentation and Consolidation Opportunity
Many organizations unknowingly purchase the same category from dozens of suppliers across different business units — often at significantly different price points. This fragmentation is invisible in single-axis reporting but becomes clear through spend cube analysis, which cross-references supplier, category, and cost center simultaneously.
The question it answers: how much spend in this category is going to how many suppliers, from which parts of the business, under what terms? The answer frequently reveals that 60–70% of category spend could be consolidated under two or three preferred contracts — unlocking volume leverage that doesn't currently exist.
Contract Compliance and Maverick Spend Leakage
Even where preferred contracts exist, off-contract buying erodes negotiated value. According to WorldCC research, organizations lose an average of 11% of contract value — and most don't formally track it.
KPMG benchmarks show leading procurement organizations achieve 92% contract compliance, compared to 85.5% for average organizations. That 6.5-point gap, applied across addressable spend, represents a meaningful and recoverable savings opportunity.
Contract spend analysis compares actual purchasing patterns against contracted terms and preferred suppliers — surfacing the leakage between negotiated value and realized value.
Price Variance and Payment Term Opportunities
Item-level spend analysis frequently surfaces instances where identical goods or services are purchased at significantly different prices across sites, business units, or time periods. This indicates fragmented buying, expired contract terms, or simply a lack of leverage consolidation.
Payment term analysis is similarly underutilized. Reviewing terms across the supplier base often reveals:
- Suppliers where extended terms could be negotiated without relationship risk
- Early payment discount programs that are being missed
- Inconsistent terms across the same category, signaling an absence of policy
Neither analysis requires complex modeling. What it requires is spend data structured at the item and supplier level — the foundation that makes every other savings opportunity in this section visible.
Advanced Analytics Techniques for Identifying Savings Opportunities
Spend Cube Analysis
The spend cube is a three-dimensional analytical lens: supplier × category × cost center. Rather than viewing spend through a single axis (total spend by supplier, or total spend by category), the cube reveals how spend is distributed across all three dimensions simultaneously.
This matters for sourcing strategy. A category that appears well-managed at the enterprise level may actually be fragmented across 12 business units, each with different suppliers and terms. The cube makes that fragmentation visible and quantifies the consolidation opportunity.
Pareto and ABC Analysis
The Pareto principle applied to procurement data is directional and practical: roughly 20% of suppliers or categories account for roughly 80% of spend. ABC classification extends this by segmenting the full supplier portfolio into priority tiers:
- A-tier: High spend, strategic sourcing focus
- B-tier: Mid-range spend, contract management focus
- C-tier: Low spend, consolidation and automation candidates
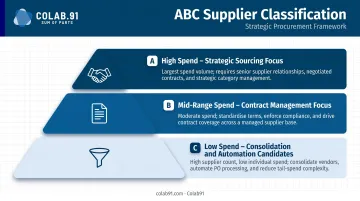
This prevents analytical effort from being spread evenly across a supplier base of thousands — focusing resources where return on analysis is highest.
Category Profiling and Price Variance Analysis
Category profiling builds a structured picture of spend within a defined procurement category: who supplies it, at what prices, from which business units, under what contract terms, and against what market benchmarks.
Price variance analysis within that profile identifies overpayment relative to negotiated rates or market comparables. The output is targeted renegotiation — not broad cost reduction targets, but specific supplier conversations backed by data showing exactly where the gap is.
Key inputs that drive meaningful price variance analysis:
- Negotiated contract rates vs. actual invoice prices
- Peer benchmarks for comparable spend categories
- Historical price trends across business units and geographies
Predictive Analytics for Demand and Pricing
Predictive analytics uses historical spend trends, seasonal patterns, and external market signals to forecast price movements and demand shifts before they materialize. This creates proactive sourcing windows — locking in favorable pricing ahead of anticipated increases, or adjusting order volumes to avoid premium spot-buy costs.
Running continuous predictive models across categories requires dedicated capacity that most lean procurement teams can't sustain alongside day-to-day sourcing work. That capacity gap is where dedicated offshore analytics teams create the most direct value.
Colab91 builds procurement analytics teams for exactly this purpose — giving mid-market and PE-backed companies continuous category-level analysis and predictive modeling without expanding permanent headcount. The founding team previously scaled offshore procurement operations to 100+ practitioners serving firms including Carlyle Group and TPG, bringing the domain depth needed to turn model outputs into actual sourcing decisions.
Building the Data Foundation for Savings Discovery
Advanced analytics is only as reliable as the data underneath it. That gap is the most common reason savings initiatives stall before they produce results.
Deloitte identifies data quality as the top barrier to procurement digitization, and Hackett reports 48% of organizations cite data quality as a major concern for AI adoption. McKinsey adds that only 20%–40% of data needed for tendering is centrally stored and readily available in most organizations.
Common Data Quality Problems
- Fragmented ERP data across business units or acquired companies, with no unified spend view
- Inconsistent supplier naming — the same supplier appearing as 12 different entities across systems
- Misclassified spend categories — making category-level analysis unreliable from the start
- Missing PO or invoice line-item data — reducing analysis to aggregate totals rather than item-level insight
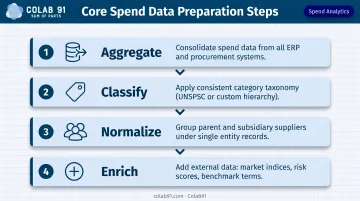
Core Data Preparation Steps
- Aggregate spend data from all ERP and procurement systems into a single data layer
- Classify spend into a consistent category taxonomy — either UNSPSC or a company-specific hierarchy
- Normalize suppliers by grouping parent and subsidiary entities under a single entity record
- Enrich with external data: market price indices, supplier risk scores, benchmark payment terms
These steps do more work than most teams expect. McKinsey found that heuristic rules alone improved data quality by 20%–50%, with analytical models contributing a further 10%–30% — meaning the bulk of analytical value is unlocked before any insight work begins.
Tool Choice: A Practical Decision
| Approach | Strength | Limitation |
|---|---|---|
| Excel | Accessible, flexible | Doesn't scale; no procurement-specific logic |
| BI tools (Power BI, Tableau) | Strong visualization | No procurement domain intelligence |
| Purpose-built spend analytics platforms | Faster classification; procurement-specific | Higher cost and implementation overhead |
| Dedicated analytics team | Domain expertise + continuous execution | Requires the right talent model |
The right choice depends on organizational scale and analytical ambition. For mid-market companies without large internal analytics functions, a dedicated offshore analytics team — one structured around procurement-specific outputs rather than generic dashboards — typically delivers better domain depth at lower cost than building that capability in-house.
How to Measure and Track Procurement Cost Savings
Hard Savings vs. Cost Avoidance
Every savings initiative falls into one of two categories:
- Hard savings (cost reduction): Spending less than previously on the same goods or services — through renegotiation, consolidation, or substitution. This shows up in actuals.
- Cost avoidance: Preventing a planned cost increase from materializing — such as locking in pricing ahead of a market increase, or renewing a contract before an automatic rate escalation. Per ISM's definition, cost avoidance is a preemptive action not reflected in financial statements or budgets.
Both are legitimate. Both need to be tracked. But they must be reported separately — finance and PE sponsors treat them differently, and conflating them undermines procurement's credibility with the CFO.
Establishing a Credible Baseline
Once you've distinguished the savings type, the next step is anchoring it to a defensible number. Every savings initiative needs a baseline — without one, the figure is unauditable. The baseline should reflect one of the following, depending on the savings type:
- Prior year price or contract rate
- Current contracted rate (for new negotiations)
- Budget forecast (for cost avoidance scenarios)
The most common reporting failure is claiming savings without a documented, defensible baseline. That erodes trust with finance — and with PE sponsors who are managing against specific EBITDA targets.
Tracking Captured Value
A solid baseline tells you what was targeted. What it can't tell you is whether the savings actually landed. Identifying savings and capturing savings are different things. Deloitte's data shows that only 69% of procurement organizations hit or exceeded cost-reduction targets in 2023, down from 84% in the prior study — meaning many identified savings never appear in actuals.
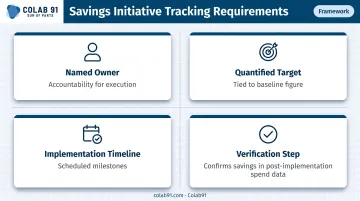
Each savings initiative should have:
- A named owner accountable for execution
- A quantified target tied to the baseline
- A timeline for implementation
- A verification step confirming the savings appear in post-implementation spend data
Leading KPIs to Track Over Time
- Savings as a % of addressable spend — measures the productivity of procurement effort
- Spend under management — KPMG benchmarks show leaders control 78% of spend vs. 30% for average organizations
- Contract compliance rate — tracks whether negotiated savings are actually being realized
These metrics give procurement leaders and PE sponsors a way to assess whether the analytics investment is translating into EBITDA impact — not just reports.
Frequently Asked Questions
How do you identify cost-saving opportunities in procurement?
Cost savings opportunities are identified by analyzing spend data through techniques like spend cube analysis, ABC classification, tail spend analysis, category profiling, and contract compliance monitoring. The goal is to surface fragmentation, price variance, off-contract buying, and supplier consolidation opportunities that don't appear in standard ERP reporting.
How do you measure savings in procurement?
Procurement savings are measured by comparing actual spend against a defined baseline — either a prior price, contracted rate, or budget forecast. Hard savings and cost avoidance are tracked separately, with each initiative assigned an owner, a quantified target, and a post-implementation verification step to confirm the savings appear in actual spend data.
What are the 5 P's in procurement?
The 5 P's typically refer to People, Process, Policy, Performance, and Price (or Product, depending on the framework). Each maps to a measurable dimension of procurement improvement — from how teams execute and comply with policy, to how pricing is benchmarked and validated through analytics.
What is the difference between cost savings and cost avoidance in procurement?
Cost savings reduces actual spend below a prior baseline (for example, renegotiating a contract to a lower rate). Cost avoidance prevents a planned increase from occurring — such as locking in pricing before an anticipated market rise. They are reported separately because each affects financial statements differently.
What are the most common sources of procurement cost savings?
The most frequently identified sources are: supplier consolidation, contract renegotiation, tail spend management, demand rationalization, payment term optimization, and elimination of maverick or off-contract spending. The highest-impact opportunities vary by organization, which is why spend data analysis — not a generic savings target — is always the right starting point.