Most companies discover this problem the hard way. They build an offshore team in procurement, analytics, or finance, and spend the first year reacting to output issues rather than anticipating them. The informal performance signals that work in a co-located environment — a quick hallway conversation, a glance at someone's screen — simply don't exist when your team is operating across time zones.
This guide covers a practical KPI framework organized into three functional categories, how to set it up before you start measuring anything, and the mistakes that trip up even experienced offshore operators. It's built for multi-functional offshore teams — not just software developers.
TL;DR
- KPIs are the communication bridge between offshore teams and onshore stakeholders — track them, or performance stays invisible
- Organize offshore KPIs into three categories: Productivity & Output, Quality & Cost Efficiency, and Communication & Engagement
- Establish baselines in the first 60–90 days before setting targets; arbitrary benchmarks follow when you skip this step
- Track 6–8 metrics consistently rather than 30 metrics inconsistently
- Co-design KPIs with the offshore team — imposed targets drive compliance behavior, not performance improvement
Why KPIs Matter More for Offshore Teams Than In-House Teams
The Visibility Gap Is Real
When a team is co-located, managers absorb performance signals constantly — through informal conversations, observable energy, and proximity. None of that transfers to an offshore setup. What replaces it has to be deliberate.
Without structured KPIs, offshore teams naturally default to effort metrics: hours logged, emails sent, meetings attended. These feel like performance data but don't actually measure whether work is driving business outcomes. The gap between activity and results can go undetected for months.
KPMG's outsourcing research identifies unclear objectives and expectations as a primary driver of outsourcing disputes — not technical failures, but measurement failures. SLAs and KPIs, when properly designed, function as governance infrastructure. When they're absent or poorly constructed, misalignment grows unchecked until it surfaces as a service delivery problem.
The PE and Investor Dimension
For PE-backed companies, the stakes are higher. Offshore operations need to demonstrate measurable ROI to justify continued investment during quarterly business reviews. KPIs are the language in which that value gets communicated to sponsors and boards.
Colab91's leadership team built and scaled offshore capability centers for PE clients including Carlyle Group, TPG, and Elliott — and the pattern is consistent. Sponsors don't ask whether the offshore team is busy. They ask specific, measurable questions:
- Are output volumes up?
- Are error rates down?
- Is cost per unit trending in the right direction?
Those answers require structured measurement from day one.
How to Build Your Offshore KPI Framework Before Measuring Anything
Align Before You Measure
Before you track a single metric, agree on what success actually looks like. The right starting question isn't "what should we measure?" — it's "what outcomes does this offshore team need to deliver in the next 90 days?" Start there, then identify the metrics that tell you whether you're on track.
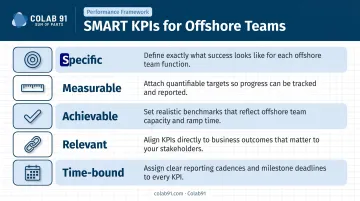
KPMG's outsourcing guidance specifically recommends using SMART KPIs in outsourced and offshore contexts:
- Specific — tied to a defined output, not a general activity
- Measurable — trackable with available data or tools
- Achievable — accounts for ramp-up periods (Alvarez & Marsal notes GCC ramp-up typically takes 12–18 months)
- Relevant — maps to a business objective, not a proxy metric
- Time-bound — reviewed on a defined schedule
The Baselining Step
For a new offshore team, the first 60–90 days should focus on establishing baselines — not hitting targets. Jumping straight to performance targets without knowing what "normal" looks like for this team creates two problems.
First, you end up with arbitrary standards that demotivate the team from the start. Second, you lose the ability to distinguish genuine improvement from statistical noise.
During the baseline period, collect data across three dimensions:
- Turnaround times — how long tasks take end to end
- Output volumes — how much work the team completes per cycle
- Error rates — how often rework or corrections are required
Set targets only after that data exists. For specialized functions like spend analytics or financial modeling, this step is non-negotiable — task complexity varies enough across work types that any target set without baseline data will be wrong.
Productivity & Output KPIs
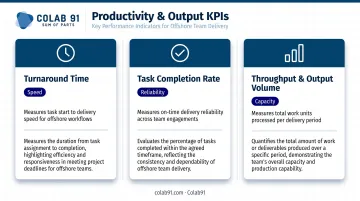
Turnaround Time (TAT)
TAT measures the time between when a task is assigned and when it's delivered. It's the most universally applicable productivity KPI across offshore functions — whether the team is producing procurement category analyses, financial close packages, or data pipeline outputs.
To measure it effectively:
- Define clear task boundaries (what constitutes "started" vs. "completed" for each work type)
- Track it using project management tooling, not manual logs
- Segment by task type or complexity so averages aren't distorted by outlier workloads
A useful external benchmark: APQC reports a median of 8.0 days to complete monthly financial close in finance shared services centers. That's a starting reference point for finance offshore teams — your baseline may differ, but it gives a calibration anchor.
Task Completion Rate
Task Completion Rate is the percentage of assigned tasks completed within the agreed timeframe. Unlike TAT, which measures speed, completion rate measures reliability.
A consistently high rate signals appropriate capacity and clear scope. A declining rate is an early warning worth investigating: it typically points to overloading, unclear requirements, or a process breakdown upstream from the team.
For offshore teams, completion rate is valuable because it's visible without requiring close management oversight. A weekly report is enough to spot trends before they become problems.
Throughput and Output Volume
Throughput is total work units processed within a defined period — supplier contracts reviewed per week, reports generated per month, datasets processed per sprint.
This metric is most useful for offshore teams handling high-volume, repeatable work — common in analytics, procurement category management, and finance operations. Three months of throughput data unlocks several practical levers:
- Set credible productivity improvement targets based on actual baselines
- Identify where automation would have the highest impact
- Benchmark team output against prior periods or comparable functions
Quality, Accuracy & Cost Efficiency KPIs
Error Rate and Rework Rate
These two metrics are related but diagnose different problems:
- Error Rate — percentage of deliverables that contain defects or fail quality review. Flags output-level quality issues.
- Rework Rate — percentage of completed work that has to be redone. Reveals upstream process and communication failures.
For offshore teams handling data-intensive work — spend analytics, financial modeling, procurement analysis — accuracy isn't optional. Gartner research estimates poor data quality costs organizations at least $12.9 million per year on average. Roughly 59% of organizations don't measure this cost at all. A single inaccurate spend analysis can cascade into a flawed sourcing decision worth multiples of the offshore team's annual cost.
Track both metrics separately. If error rate is high but rework rate is low, the quality problem is in execution. If rework rate is high, the problem is usually in requirements definition or handoff — an onshore issue as much as an offshore one.
SLA Adherence Rate
Once you've isolated where quality breaks down, SLA adherence gives you the aggregate signal. It measures the percentage of deliverables that meet the quality and turnaround standards defined in the offshore engagement agreement — and tells you whether the operating model is working as designed.
Consistently low SLA adherence has two possible root causes — and it matters which one you're dealing with:
- The SLAs were unrealistic to begin with (a design problem)
- The offshore team's processes or resourcing are insufficient (an operational problem)
Treating these the same way produces the wrong fix. Review SLA design every quarter alongside adherence data.
Cost Per Output and ROI on Offshoring
Cost Per Output = total operational cost of the offshore team ÷ volume of defined outputs in a given period. It converts offshore investment into unit economics, making efficiency directly comparable across time periods and functions.
The ROI calculation is straightforward in structure:
- Calculate the fully-loaded cost of equivalent onshore resources (salary, benefits, overhead, management time)
- Tally the total cost of the offshore team, including any management overhead
- Divide by output volume and quality-adjust for error rates
- Compare the two cost-per-output figures
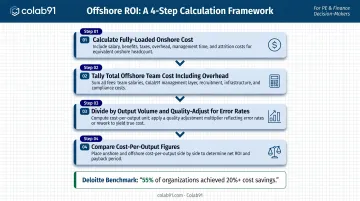
Deloitte's 2025 Global Business Services survey found that 55% of organizations using a dedicated global GBS leader achieved average cost savings exceeding 20%. That's the benchmark range to target — but the calculation only works if output volume and quality are being tracked alongside cost.
For PE-backed companies, this calculation is the primary ROI justification metric. Colab91 structures offshore capability center engagements around exactly these figures: defined output benchmarks, tracked cost per unit, and quality-adjusted comparisons that replace anecdotal performance reports with data that holds up to sponsor scrutiny.
Communication, Collaboration & Team Engagement KPIs
Response Time and Collaboration Effectiveness
Response Time — the average time for the offshore team to acknowledge and act on queries from onshore counterparts — is a proxy for operational agility. A team that responds slowly to escalations or blockers doesn't just create delays on individual tasks. It erodes the onshore team's confidence in the partnership, which compounds over time: work gets assigned differently, and the offshore team's autonomy quietly shrinks.
Beyond response time, measure collaboration effectiveness through:
- Stand-up or sync attendance rates
- Quality of async documentation (can a handoff note be acted on without a follow-up call?)
- Pulse surveys capturing onshore sentiment about working with the offshore team
McKinsey research found that teams with above-average trust scores are 3.3 times more efficient and 5.1 times more likely to produce results for stakeholders than low-trust teams. Responsiveness is one of the clearest, most trackable ways trust gets built — or lost.

eNPS and Retention Rate
Track these two metrics together: eNPS tells you where morale is heading; retention rate tells you what's already happened.
Employee Net Promoter Score (eNPS) measures how likely offshore team members are to recommend their workplace — a reliable proxy for engagement and morale. Gallup's meta-analysis across 100,000+ teams found that top-quartile engagement business units show 23% higher profitability, 14% higher productivity, and 21–51% lower turnover compared to bottom-quartile units.
Retention Rate is often the most overlooked KPI for offshore teams, and frequently the most consequential. Losing a trained team member in a specialized function — procurement analysis, financial modeling, spend analytics — doesn't just create a vacancy.
It destroys months of accumulated context: client knowledge, process familiarity, system navigation, and the institutional memory of how the onshore team prefers to work.
EY's GCC research reports that India GCCs experienced an average attrition rate of 12.5%, with nearly 60% of GCCs reporting attrition between 5% and 15%. That's the benchmark range. Anything above 15% warrants an active retention strategy.
At Colab91, building a low-attrition offshore culture is a design decision from day one — structured around meritocracy, work-life balance, and genuine integration between offshore team members and client culture.
Common Mistakes When Tracking Offshore KPIs
Metric Proliferation
Organizations launching an offshore KPI program often define 20–30 metrics simultaneously. The result: overwhelming reporting overhead, inconsistent data collection, and a team that optimizes for data entry rather than actual performance.
Start with 6–8 core metrics across the three categories. Add more only after the foundation is solid.
Measuring Activity Instead of Outcomes
Hours logged, emails sent, and meetings attended are inputs. They create the appearance of oversight without measuring business value. Every KPI should trace back to a defined output or business outcome — otherwise it drives compliance behavior, not performance improvement.
HBR has documented how metrics detached from strategy get gamed or start incentivizing the wrong behavior entirely.
Imposing KPIs Without Context
An offshore team that receives targets without understanding the business rationale will optimize for the number, not the goal. Rushing turnaround time at the expense of accuracy is a common result.
Co-designing KPIs with the offshore team — explaining why each target exists and what it connects to — shifts the dynamic from box-checking to genuine performance improvement.
Colab91 builds this into its offshore capability center model: KPI frameworks are designed, explained, and agreed upon before the first team member is onboarded, so the team knows what they're being measured on and why from the start.
Frequently Asked Questions
How do you effectively manage an offshore team?
Effective offshore management rests on three pillars: clear KPIs and defined output expectations, consistent communication rhythms (weekly operational syncs, not ad hoc check-ins), and a deliberate investment in team culture and engagement to keep attrition low. All three need to be in place simultaneously.
What are the top KPIs for managing offshore teams?
The six most universally applicable KPIs across functions are Turnaround Time, Task Completion Rate, Error Rate, SLA Adherence, eNPS, and Retention Rate. The right mix depends on the function — analytics teams weight accuracy metrics more heavily, while high-volume procurement teams prioritize throughput and completion rate.
How often should you review KPIs for an offshore team?
Use a tiered cadence: operational KPIs (TAT, completion rate) reviewed weekly; quality and cost KPIs reviewed monthly; strategic KPIs (ROI, retention) reviewed quarterly, aligned with business planning cycles.
What is a good KPI framework for a non-tech offshore team?
The three-category framework — Productivity & Output, Quality & Cost Efficiency, and Communication & Engagement — applies across procurement, analytics, finance, and operations teams. Specific metrics adapt to the function: a procurement team tracks contracts reviewed per week; a finance team tracks close cycle time.
How do you set KPI targets for a new offshore team?
Spend the first 60–90 days collecting baseline data before setting targets. Then apply the SMART framework, starting with conservative benchmarks that account for the team's ramp-up period. Targets set before baselines exist are arbitrary — they either demoralize a capable team or mask a genuine performance problem.